
0


One thing I learnt a long time ago - was that statistics can be manipulated any way you like.
But one thing is certain we have got a defensive effort with our Western Force that we can be proud of and here are the statistics to prove it.
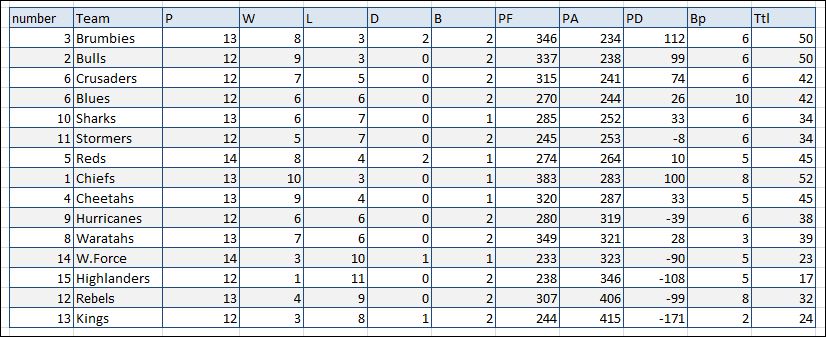
What we have here is a table of the Super15 with a sort bias based on Points Scored against. (only)
It sure does make for interesting reading.
Whilst this shows that we are in 12th position take a look at the 2 teams above us - that are only 4 points away from us (again I am talking about points scored against us).
OK you can call me a glass half full kind of guy and I will accept that. But I feel that this is a better reflection on our teams effort for this Season and a definite way of showing that Michael Foley and Coaching staff are going in the right direction.
* Team P W L D B PF PA PD Bp Ttl
3 Brumbies 13 8 3 2 2 346 234 112 6 50
2 Bulls 12 9 3 0 2 337 238 99 6 50
6 Crusaders 12 7 5 0 2 315 241 74 6 42
6 Blues 12 6 6 0 2 270 244 26 10 42
10 Sharks 13 6 7 0 1 285 252 33 6 34
11 Stormers 12 5 7 0 2 245 253 -8 6 34
5 Reds 14 8 4 2 1 274 264 10 5 45
1 Chiefs 13 10 3 0 1 383 283 100 8 52
4 Cheetahs 13 9 4 0 1 320 287 33 5 45
9 Hurricanes 12 6 6 0 2 280 319 -39 6 38
8 Waratahs 13 7 6 0 2 349 321 28 3 39
14 W.Force 14 3 10 1 1 233 323 -90 5 23
15 Highlanders 12 1 11 0 2 238 346 -108 5 17
12 Rebels 13 4 9 0 2 307 406 -99 8 32
13 S.Kings 12 3 8 1 2 244 415 -171 2 24
Sorry for the formatting - I hope one of our MODS can fix this
Last edited by .X.; 28-05-13 at 14:12.
Exile
Sydney
"Pain heels. Chicks dig scars and Glory lasts forever." Shane Falco

Exile - I drank your water.
But seriously, I think you are right.
I also think that the "calm your expectations" talks we were given at the beginning of the season by M Foley have worked, because I am far happier at this stage of the season than I was say last year or the year before. At the beginning of those season we were told - we've signed him and him and it's going to great and we might reach the finals blah blah blah.
The stats prove that it's not all just brain-washing.
Last edited by WF1964; 28-05-13 at 14:28.

For or against, win or loss...........it's still 12th or 14th depending on your glass
I backed them for a home final
I am a keg half full kind of guy.........and 14th doesn't take home the bacon
Time to hire some backs with talent, speed and try scoring ability. The hardest job in super rugby is being a Force forward. The front 8 have rarely been beaten in our time in pro rugby. Our backs are and have always been well short of the bar
Controversy corner

Use all the stats you want to paint a picture that you like but at the end of the day it's the numbers in the "Wins" column that make a season
Yes effort has been there in defence but we need a back line thats going to score some points

Except maybe this year, where they have been smashed in the scrums by the brumbies reserves bench, lost plenty of their own lineout ball every match, were mauled 50m by the bulls for a try, and don't seem to be able to run onto the ball or support their pick and drives in attack.Originally Posted by Rex Messup

Take the blinkers off Rex. Much as I would love to claim that our forwards have been as good this year as in past years, it isn't the case.
We need improvement across the park including the forwards.
Posted via Mobile Device

as much as I dislike excel, it has its uses!
Thanks Uncle B. much appreciated.
Exile
Sydney
"Pain heels. Chicks dig scars and Glory lasts forever." Shane Falco

if you took away the brumbies game we would be pushing the chiefs
Everyone knows whether its rugby, politics or whatever, front-rowers should rule the world, so to have a hooker at the helm makes sense, Nathan Charles Western Force & Wallabies Hooker.
Using that logic , if we took out all the losses we would be winning.
Posted via Mobile Device
true but i used that example because it is the one game where the defence had a really bad day out. if our line that day had held up much like the other weeks the ledger wouldnt be so great.
Everyone knows whether its rugby, politics or whatever, front-rowers should rule the world, so to have a hooker at the helm makes sense, Nathan Charles Western Force & Wallabies Hooker.

Looking at another column, we have the potential to leapfrog the Kings on the genuine table this week
They might struggle against the Stormers, and we should be able to put the bye away without too much trouble!
C'mon the


if we hadn't missed a goal and every try was allowed we'd be in the finals
Chuck Norris has the greatest Poker-Face of all time. He won the 1983 World Series of Poker, despite holding only a Joker, a Get out of Jail Free Monopoly card, a 2 of clubs, 7 of spades and a green #4 card from the game Uno.
Shhh don't give it the kiss of death!

If you look at it on a points allowed per game, we're ahead of both the Hurricanes and Waratahs. We'd still only be 10th, mind!

If you arrange the teams alphabetically starting with W, we'd be in the top 2.
Smoke me a kipper, I'll be back for breakfast.
 Posting Permissions

 Reply With Quote
